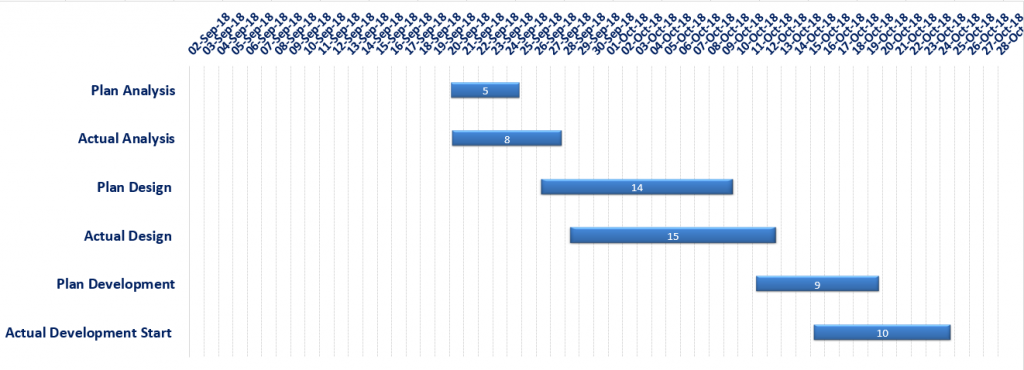
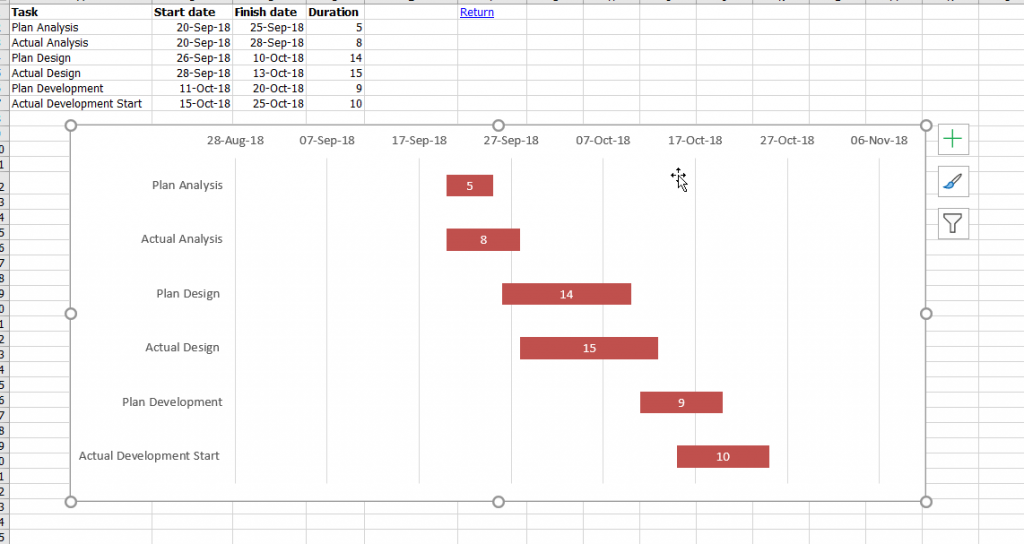
Gantt Chart is very useful chart in Project Management. Gantt chart is used for Scheduling and planning a project. A Gantt chart is a type of bar chart that demonstrates a project schedule.
1) Prepare MS Excel Sheet.
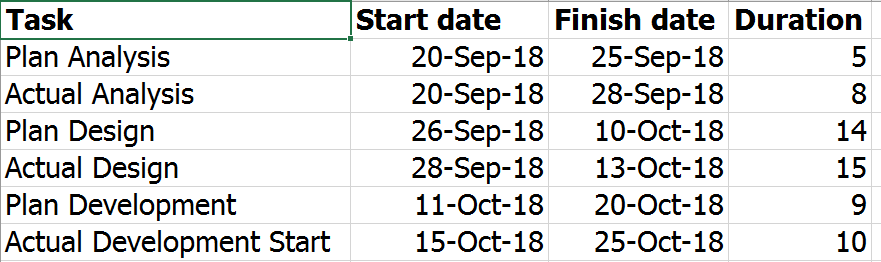
We have Four column first column contents Task name, Start Date, Finish date and Duration follow Image 1
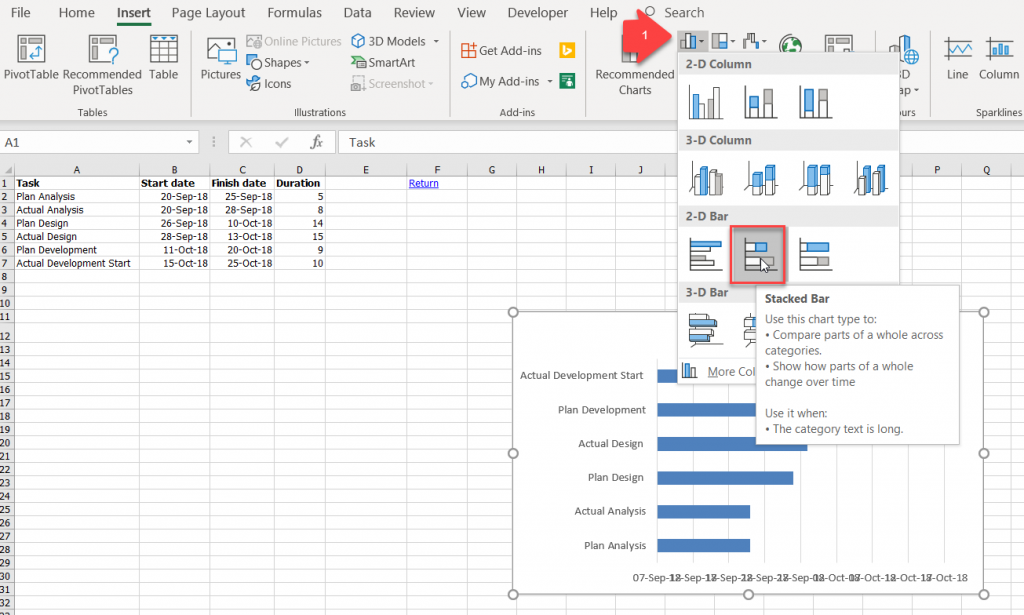
2) Select Task and Start Date column only, click on the insert Tab and select Clustered bar Chart Option.
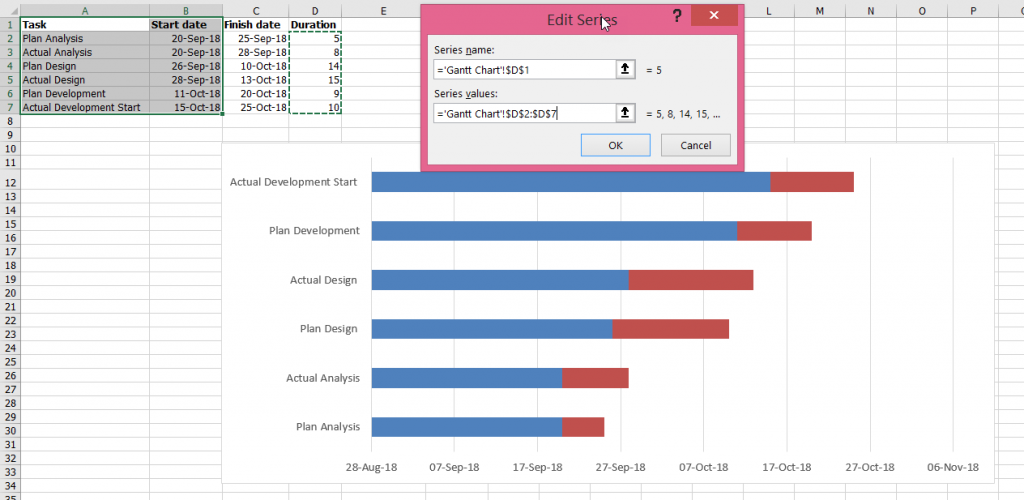
3) Select your chart and click on the design tab -> Select Data
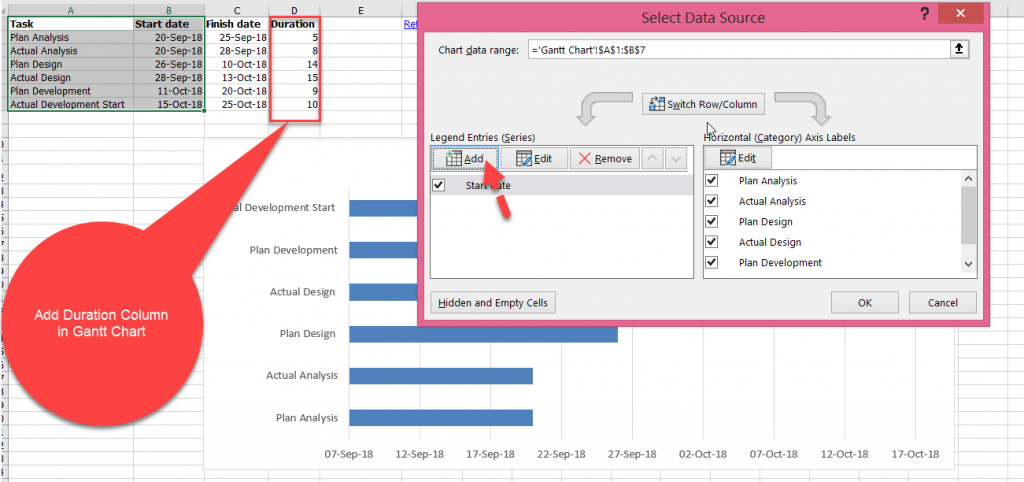
4) Click on the Add Button and add Duration Column in existing chart. follow the below screen shot.
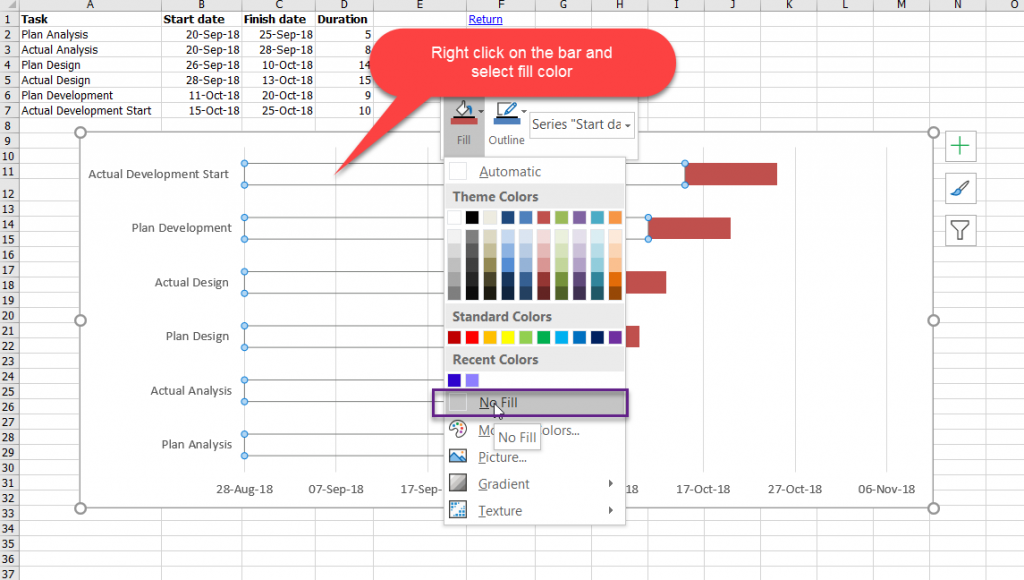
Use one tips and tricks Select Blue bar and right click make no fill.
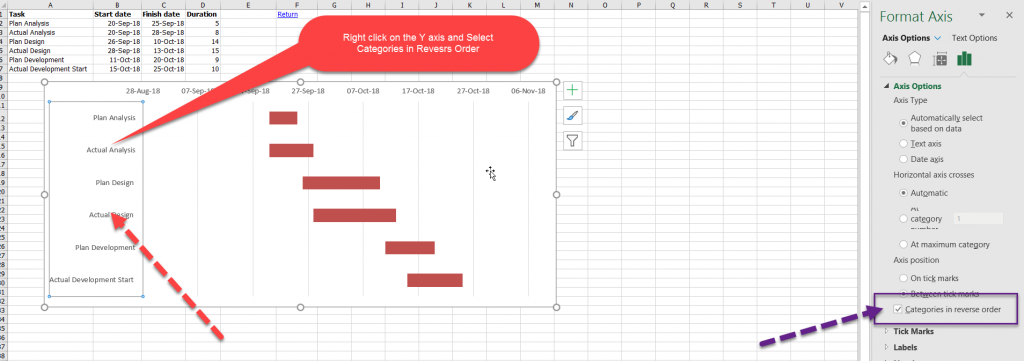
Right Click on the Y Axis -> Format Axis -> Categories in Reverse Order.
Select Time Line top of the Graph area -> Right Click -> Select Format Axis.